Problem
The history of a typhoon is split across two very different datasets. Best tracks give the centre position and intensity every few hours. Reanalysis gives the wind and rain over the whole region, every hour, but as terabytes of gridded data. Most public tools show one or the other, or only recent seasons, and none answer “which storms hit my town, and how hard?” for both the Philippines and Japan.
Approach
- Tracks: IBTrACS v04r01, Western Pacific basin: about 3,000 storms since 1940. PAGASA local names (Yolanda, Odette) are not in IBTrACS, so a sourced name crosswalk joins them.
- Fields: ERA5 hourly reanalysis (about 28 km grid, from 1940), read from the public cloud copies without an account. ERA5 is CC BY 4.0: contains modified Copernicus Climate Change Service information.
- Pipeline: scheduled GitHub Actions jobs cut a storm-following window for each hour and compress wind, gust, pressure and rain into small WebP frames per storm: lossy sheets for drawing the hourly animation, and lossless sheets every third hour that keep exact values for the readouts. The same jobs build per-municipality exposure tables as partitioned Parquet.
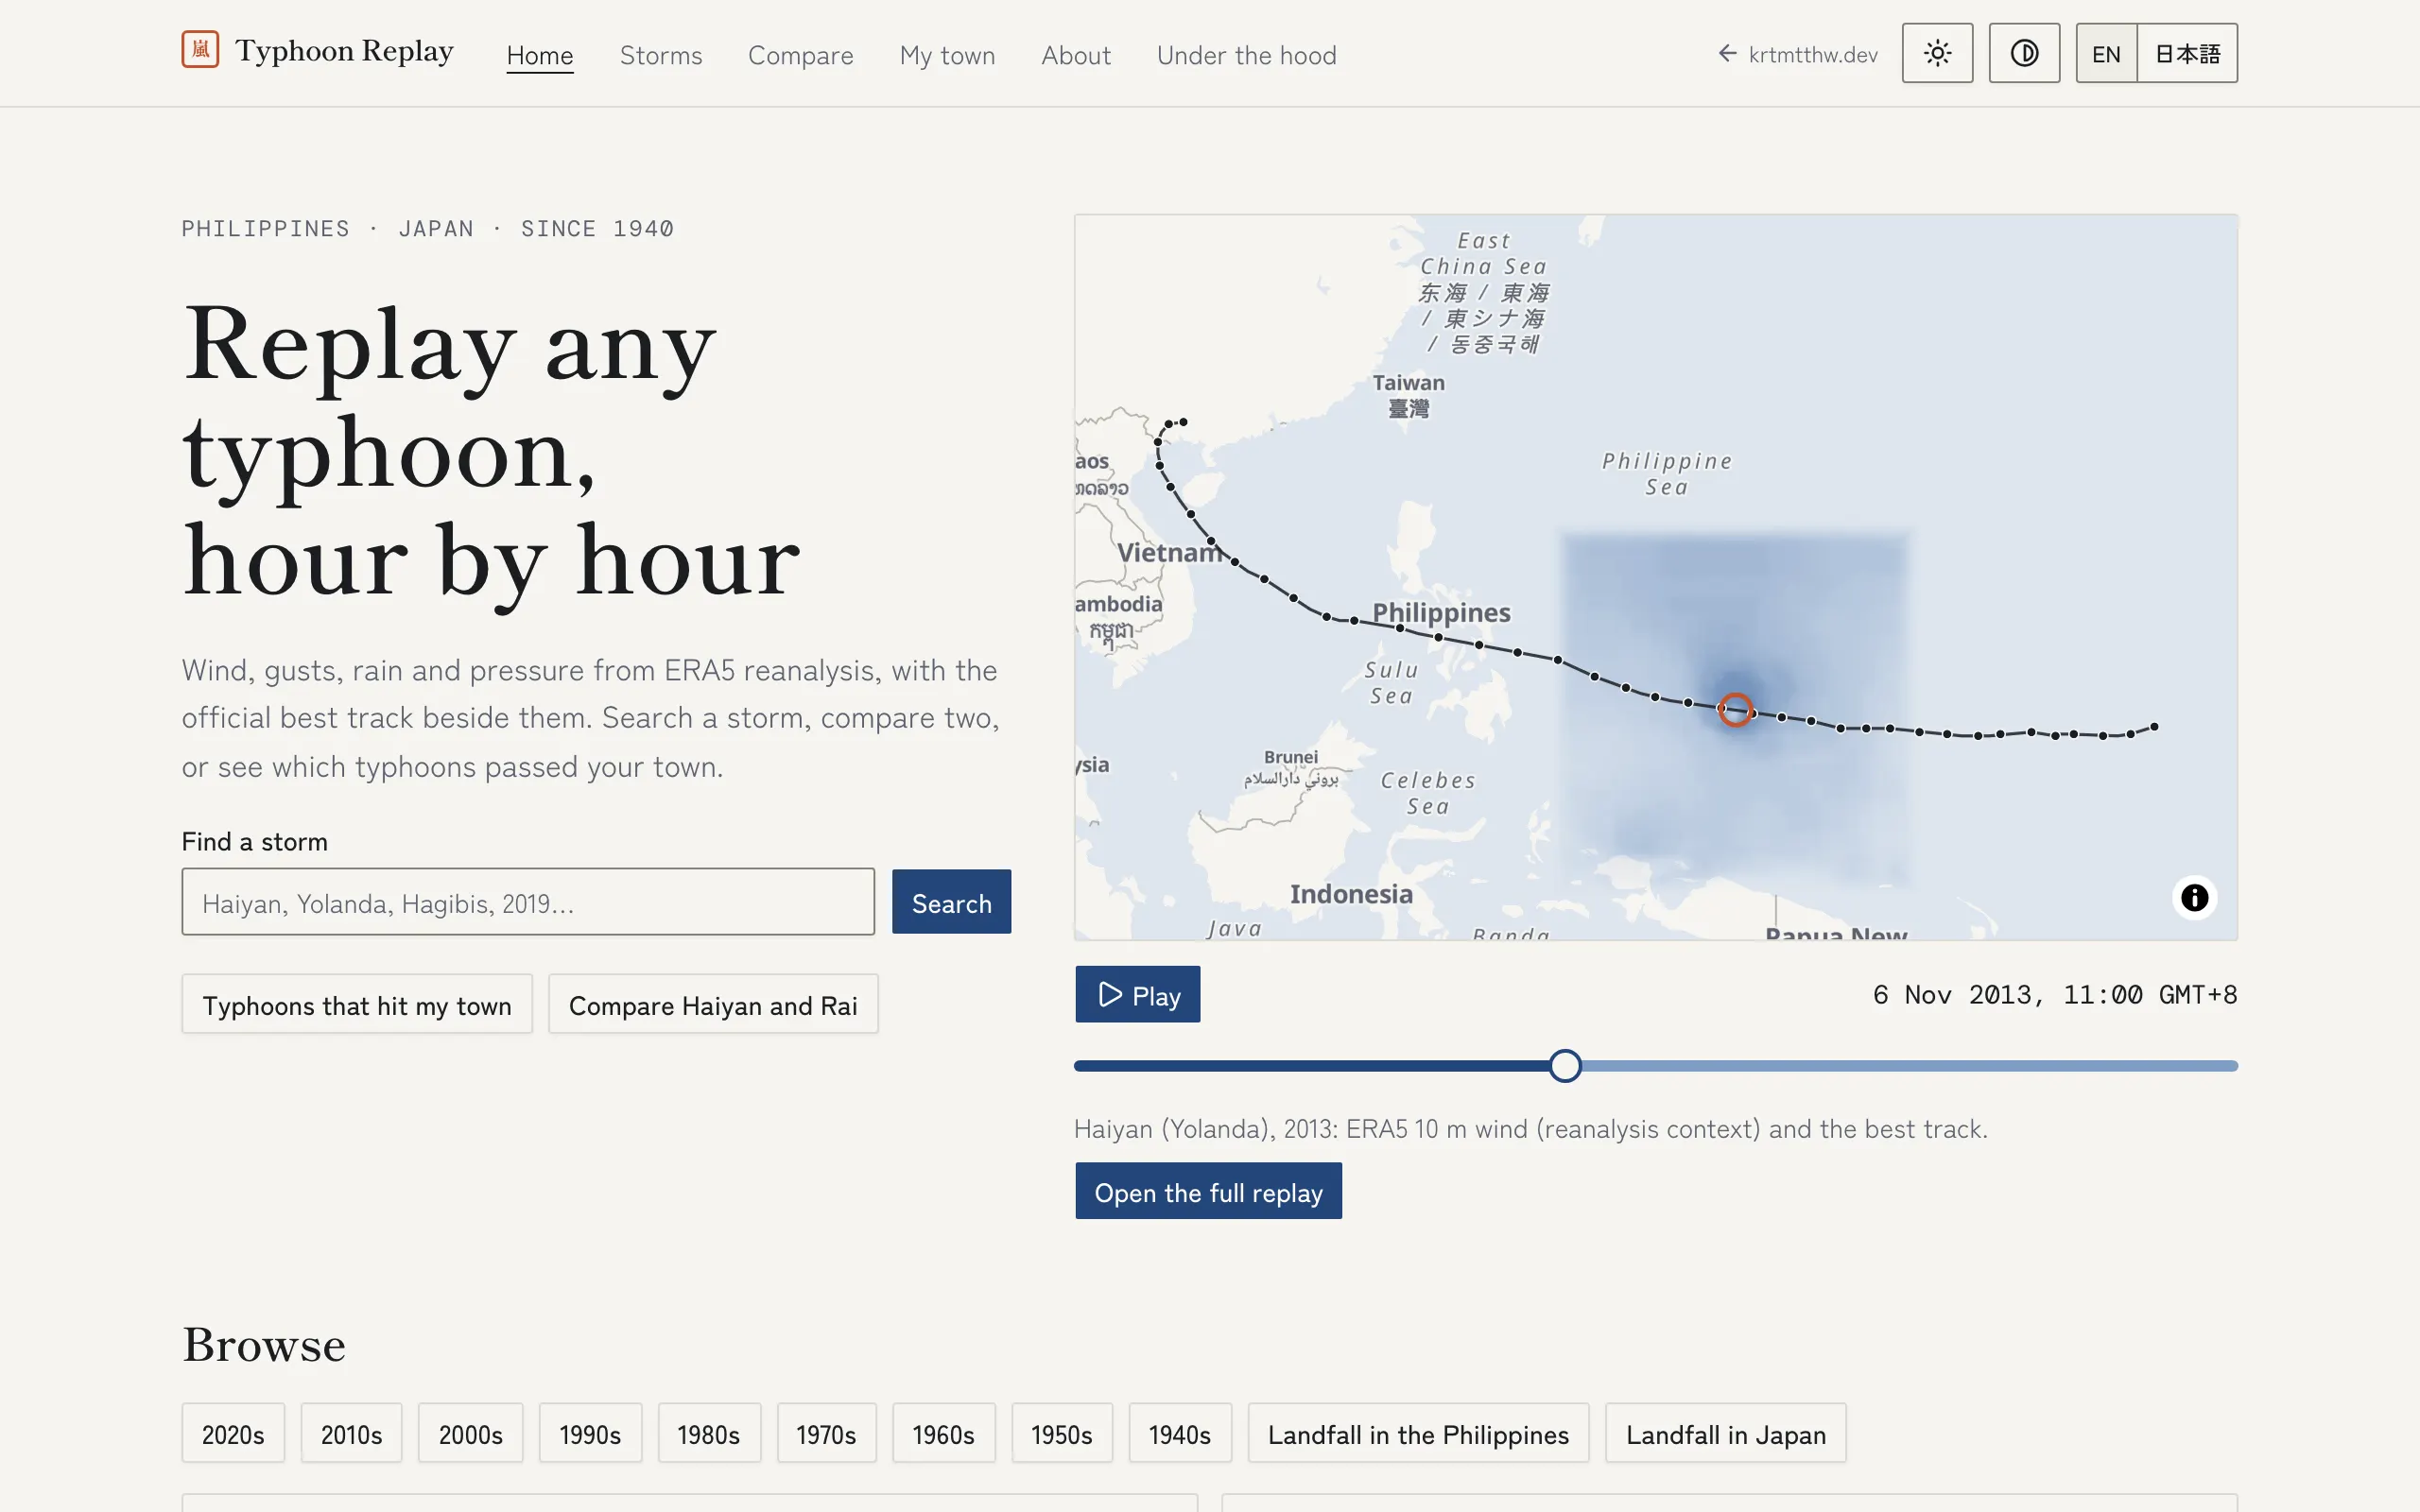
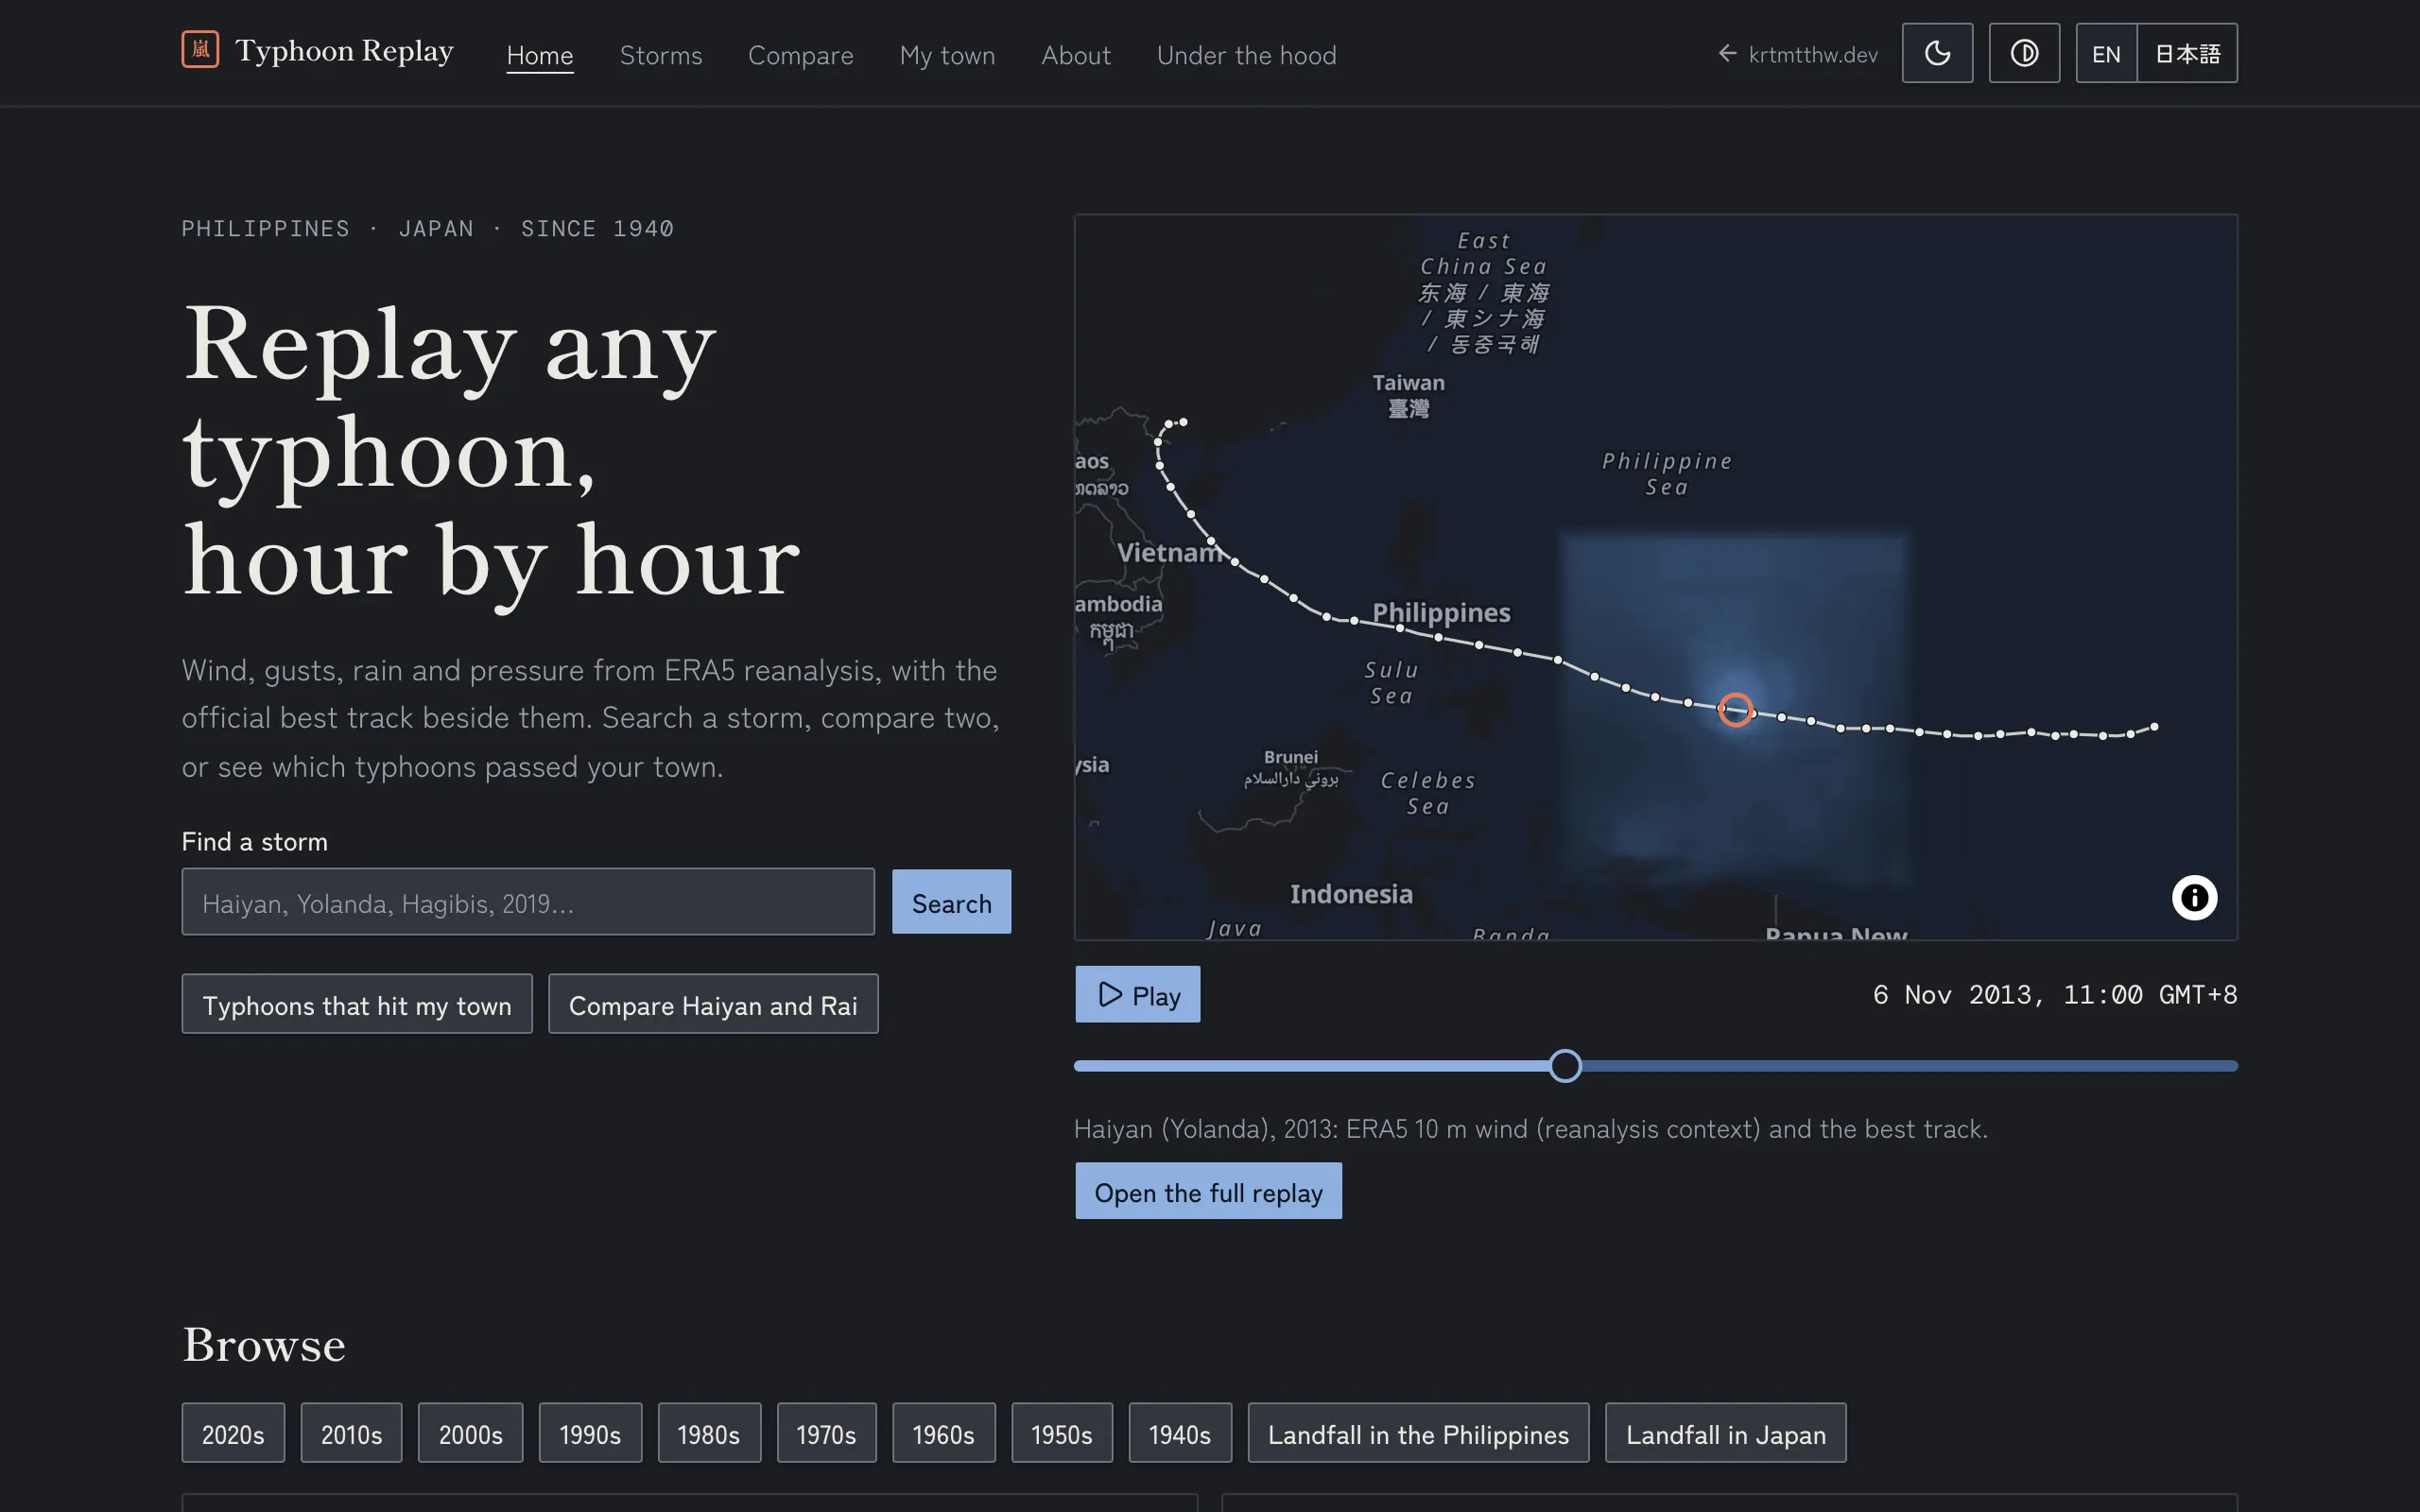
- Replay: a static web app animates the frames on a MapLibre map with the best track, drawing the field and wind particles in a custom WebGL2 layer, in English and Japanese. The timeline table is the text alternative to the map.
- One contract, four backends: the dynamic parts (search, compare, exposure queries) are specified once in OpenAPI and implemented four times, in Java (Spring Boot), Node, Rust and Go. Each backend passes the same contract tests and can be swapped in behind the same front end.
- Honesty about the data: reanalysis smooths the eyewall of intense typhoons, so the replay labels the field as “reanalysis context” and shows the best-track intensity beside it.
Architecture
Standard pattern: a static-first single-page app over a contract-first API.
Customisations: one origin and four engines, so a same-origin proxy routes
/api/{java,node,rust,go}/ to four interchangeable backends that share one
PostGIS database; the heavy data is precomputed by scheduled jobs and read
straight from a Hugging Face dataset, so the replay itself needs no backend.
01 · Sources
- IBTrACS best tracks (NOAA NCEI)
- ERA5 hourly reanalysis (public buckets)
- PAGASA name crosswalk
02 · Pipeline
- GitHub Actions matrix
- Storm-following windows, hourly
- WebP frames, data-quality tests
03 · Artefacts
- WebP frames per storm (Hugging Face dataset)
- Exposure tables (Parquet)
- Storm index (JSON)
04 · Serving
- Static replay on Cloudflare Pages
- OpenAPI contract
- Java · Node · Rust · Go backends
Where it stands
Live at typhoon.krtmtthw.dev, in English and Japanese. 51 storms are fully replayable, with their ERA5 fields; the rest of the 2,058-storm catalogue is being backfilled.
The Java backend (Spring Boot) is live, implements the shared contract and is tested against it; the “Under the hood” page in the app shows it at work. Next: the Go, Node and Rust backends, against the same contract tests.
Known limitation: ERA5 understates the winds in the cores of intense typhoons, which is why the field is labelled as reanalysis and the official best-track intensity is always shown beside it.